
Berkshire Hathaway Annual Meeting History (1965 to 2026)
The Berkshire meeting began in 1965 with about a dozen people in the textile company’s offices in New Bedford. The theater with 2,750 seats came in 1990. By 2015 more than 40,000 people came to Omaha, and since 2016 anyone can watch it online. This page tells that story in numbers: the venues, the crowds, the BRK.A price at each meeting, the questions and the people who asked them.
How did the Berkshire meeting change from 1965 to 2026?
TL;DR: Five things changed over 62 years: how many came, where they met, who asked, how the world watched and what happened around the meeting. Three years turned several of them at once: 1985, 2009 and 2016.
The Berkshire meeting at a glance, 1965 to 2026
One row per element of the meeting. The shaded columns are the six eras. Dashed lines mark the years that changed several rows at once. On a phone, swipe the chart sideways.
Buffett invites his owners in the letter for 1984. The crowd grows from about a dozen to 250, then 1,000 by 1989. The meeting moves to Joslyn, then to the Orpheum.
A drawing replaces the 7 a.m. sprint to the microphones, and three journalists read emailed questions. The same year Buffett still says no to a webcast.
After more than 40,000 people overflowed into the Hilton in 2015, Yahoo streams the meeting. The hall stops being the only way in.
Show every row of the chart, with years
| Row | Years | What |
|---|---|---|
| Venue | 1965 to 1972 | Berkshire Hathaway offices, New Bedford |
| Venue | 1973 to 1979 | National Indemnity lunchroom, Omaha |
| Venue | 1980 to 1985 | Red Lion Inn |
| Venue | 1986 to 1989 | Joslyn Art Museum, Witherspoon Hall |
| Venue | 1990 to 1994 | Orpheum Theater |
| Venue | 1995 to 1996 | Holiday Convention Centre |
| Venue | 1997 to 1999 | Aksarben Coliseum |
| Venue | 2000 to 2003 | Omaha Civic Auditorium |
| Venue | 2004 to 2019 | Qwest Center, CenturyLink Center, CHI Health Center |
| Venue | 2020 and 2021 | Empty arena (2020) and online from Los Angeles (2021) |
| Venue | 2022 to 2026 | CHI Health Center |
| Who asks | 1985 to 1993 | Buffett answers until every owner-related question is asked |
| Who asks | 1994 to 2008 | Shareholders at open microphones, first in line |
| Who asks | 2009 to 2011 | Drawing at each microphone, plus three journalists with emailed questions |
| Who asks | 2012 to 2019 | Plus three analysts on stage |
| Who asks | 2020 and 2021 | Becky Quick only, online |
| Who asks | 2022 to 2026 | Becky Quick alternates with the hall |
| How the world watches | 1990 to 2015 | Only in the hall; cameras banned, Berkshire films its own meeting from 1994 |
| How the world watches | 2016 to 2021 | Yahoo Finance livestream |
| How the world watches | 2018 | CNBC Warren Buffett Archive opens |
| How the world watches | 2022 to 2026 | CNBC, TV and stream |
| The weekend | 1989 | Buses to Nebraska Furniture Mart and Borsheim’s |
| The weekend | 1990 to at least 2018 | Borsheim’s Shareholder Sunday |
| The weekend | 1994 to 2002 | Baseball game at Rosenblatt Stadium |
| The weekend | 1997 to at least 2017 | NFM shareholder discount |
| The weekend | 2004 to 2009 | Reception for guests from abroad |
| The weekend | 2013 | First Berkshire 5K |
| The weekend | 2015 | Exhibit hall opens on Friday |
Sources: people from Buffett’s letters and named press reports, estimates marked light; venues from proxy statements and the Omaha World-Herald (2015); 1985 from the letter for 1984 and for 1985; 2009 from the letter for 2008 and the 2009 meeting; 2016 from the letter for 2015.
Get the free Good Investing newsletter, including our Berkshire meeting updates for 2027: dates, tickets and travel tips.
Where has the Berkshire Hathaway annual meeting been held since 1965?
TL;DR: In Berkshire’s offices in New Bedford, then in eight places in Omaha. Since 2004 the meeting has used the same arena, today called CHI Health Center. Only 2021 came from Los Angeles, online.
The meeting moved four times between 1973 and 1990, each time to a bigger hall. Since 2004 it has used the same arena in downtown Omaha. The name changed twice: Qwest Center, then CenturyLink Center, then CHI Health Center. In 2020 Buffett spoke to an empty arena, and in 2021 the meeting came online from Los Angeles.
| Years | Venue | People | Why it moved here |
|---|---|---|---|
| 1965 to 1972 | 1Berkshire Hathaway officesThe textile company’s offices in New Bedford. Former site. | about a dozen | First meeting under Buffett on December 7, 1965. |
| 1973 to 1979 | 2National Indemnity lunchroomFourth floor, 3024 Harney Street. | 20 to 25 | Moved to Omaha, into the biggest room at a Berkshire company there. |
| 1980 to 1985 | 3Red Lion InnDowntown hotel, today DoubleTree by Hilton. 1616 Dodge Street. | about 12 to 250 | Buffett expected more people the next year. |
| 1986 to 1989 | 4Joslyn Art MuseumWitherspoon Hall, about 1,000 seats. 2200 Dodge Street. | about 450 to 1,000 | Likely the growing crowd: over 250 came in 1985 after Buffett invited shareholders. |
| 1990 to 1994 | 5Orpheum Theater2,750 seats. Monday meetings. In 1994 an overflow room with TVs. 409 South 16th Street. | 1,300 to over 2,750 | In 1989 about 1,000 people almost filled Joslyn’s hall. |
| 1995 to 1996 | 6Holiday Convention CentreFormer Holiday Inn Convention Center, demolished. Monday meetings. 3321 South 72nd Street. | 4,000 to 5,000 | In 1994 the crowd overran the Orpheum’s 2,750 seats. |
| 1997 to 1999 | 7Aksarben ColiseumDemolished. Monday meetings. In 1999 the Holiday hall was a second site. 6800 Mercy Road. | 7,500 to 15,000 | About 5,000 came in 1996, and the new B shares doubled the number of shareholders. |
| 2000 to 2003 | 8Omaha Civic AuditoriumDemolished. Saturday meetings from 2000 on. 1804 Capitol Avenue. | about 12,000 to 15,000 | Aksarben was losing money and closed parts of the coliseum, so seats ran short. |
| 2004 to 2020 | 9CHI Health CenterQwest Center (2004 to 2011), CenturyLink Center (2012 to 2018), CHI Health Center (2019 and 2020). In 2020 no shareholders, streamed. 455 North 10th Street. | 19,500 to about 40,000; none in 2020 | The new arena had far more seats and three times the exhibit space. |
| 2021 | 10Online, from Los AngelesAn office tower; Berkshire did not name the building. | none | Buffett came to Los Angeles so the meeting could be held with Charlie Munger, who lived there. |
| 2022 to 2026 | 11CHI Health CenterShareholders back in the arena. 455 North 10th Street. | about 12,000 to 40,000 | In-person meetings were possible again. |
In 1994, more than 1,400 shareholders went to a baseball game at Rosenblatt Stadium, two days before the meeting. It was the first game scheduled for the meeting weekend.
Show every meeting since 1965: year, date and venue
| Year | Date | Venue | City |
|---|---|---|---|
| 2026 | Saturday, May 2, 2026 | CHI Health Center Omaha | Omaha |
| 2025 | Saturday, May 3, 2025 | CHI Health Center Omaha | Omaha |
| 2024 | Saturday, May 4, 2024 | CHI Health Center Omaha | Omaha |
| 2023 | Saturday, May 6, 2023 | CHI Health Center Omaha | Omaha |
| 2022 | Saturday, April 30, 2022 | CHI Health Center Omaha | Omaha |
| 2021 | Saturday, May 1, 2021 | Online, from Los Angeles | Los Angeles (online only) |
| 2020 | Saturday, May 2, 2020 | CHI Health Center Omaha, no shareholders | Omaha |
| 2019 | Saturday, May 4, 2019 | CHI Health Center Omaha | Omaha |
| 2018 | Saturday, May 5, 2018 | CenturyLink Center Omaha | Omaha |
| 2017 | Saturday, May 6, 2017 | CenturyLink Center Omaha | Omaha |
| 2016 | Saturday, April 30, 2016 | CenturyLink Center Omaha | Omaha |
| 2015 | Saturday, May 2, 2015 | CenturyLink Center Omaha | Omaha |
| 2014 | Saturday, May 3, 2014 | CenturyLink Center Omaha | Omaha |
| 2013 | Saturday, May 4, 2013 | CenturyLink Center Omaha | Omaha |
| 2012 | Saturday, May 5, 2012 | CenturyLink Center Omaha | Omaha |
| 2011 | Saturday, April 30, 2011 | Qwest Center Omaha | Omaha |
| 2010 | Saturday, May 1, 2010 | Qwest Center Omaha | Omaha |
| 2009 | Saturday, May 2, 2009 | Qwest Center Omaha | Omaha |
| 2008 | Saturday, May 3, 2008 | Qwest Center Omaha | Omaha |
| 2007 | Saturday, May 5, 2007 | Qwest Center Omaha | Omaha |
| 2006 | Saturday, May 6, 2006 | Qwest Center Omaha | Omaha |
| 2005 | Saturday, April 30, 2005 | Qwest Center Omaha | Omaha |
| 2004 | Saturday, May 1, 2004 | Qwest Center Omaha | Omaha |
| 2003 | Saturday, May 3, 2003 | Omaha Civic Auditorium | Omaha |
| 2002 | Saturday, May 4, 2002 | Omaha Civic Auditorium | Omaha |
| 2001 | Saturday, April 28, 2001 | Omaha Civic Auditorium | Omaha |
| 2000 | Saturday, April 29, 2000 | Omaha Civic Auditorium | Omaha |
| 1999 | Monday, May 3, 1999 | Aksarben Coliseum | Omaha |
| 1998 | Monday, May 4, 1998 | Aksarben Coliseum | Omaha |
| 1997 | Monday, May 5, 1997 | Aksarben Coliseum | Omaha |
| 1996 | Monday, May 6, 1996 | Holiday Convention Centre | Omaha |
| 1995 | Monday, May 1, 1995 | Holiday Convention Centre | Omaha |
| 1994 | Monday, April 25, 1994 | Orpheum Theater | Omaha |
| 1993 | Monday, April 26, 1993 | Orpheum Theater | Omaha (downtown) |
| 1992 | Monday, April 27, 1992 | Orpheum Theater | Omaha (downtown) |
| 1991 | Monday, April 29, 1991 | Orpheum Theater | Omaha (downtown) |
| 1990 | Monday, April 30, 1990 | Orpheum Theater | Omaha (downtown) |
| 1989 | Monday, April 24, 1989 | Joslyn Art Museum (Witherspoon Hall) | Omaha |
| 1988 | Monday, May 23, 1988 | Joslyn Art Museum (Witherspoon Hall) (year range from press) | Omaha |
| 1987 | Tuesday, May 19, 1987 | Joslyn Art Museum (Witherspoon Hall) (year range from press) | Omaha |
| 1986 | Tuesday, May 20, 1986 | Joslyn Art Museum (Witherspoon Hall) (year range from press) | Omaha |
| 1985 | Tuesday, May 21, 1985 | Red Lion Inn (year range from press) | Omaha (downtown) |
| 1984 | date not known | Red Lion Inn (year range from press) | Omaha (downtown) |
| 1983 | date not known | Red Lion Inn (year range from press) | Omaha (downtown) |
| 1982 | date not known | Red Lion Inn (year range from press) | Omaha (downtown) |
| 1981 | date not known | Red Lion Inn (year range from press) | Omaha (downtown) |
| 1980 | date not known | Red Lion Inn (year range from press) | Omaha (downtown) |
| 1979 | date not known | National Indemnity lunchroom (3024 Harney St.) (year range from press) | Omaha |
| 1978 | date not known | National Indemnity lunchroom (3024 Harney St.) (year range from press) | Omaha |
| 1977 | date not known | National Indemnity lunchroom (3024 Harney St.) (year range from press) | Omaha |
| 1976 | date not known | National Indemnity lunchroom (3024 Harney St.) (year range from press) | Omaha |
| 1975 | date not known | National Indemnity lunchroom (3024 Harney St.) (year range from press) | Omaha |
| 1974 | date not known | National Indemnity lunchroom (3024 Harney St.) (year range from press) | Omaha |
| 1973 | date not known | National Indemnity lunchroom (3024 Harney St.) (year range from press) | Omaha |
| 1972 | date not known | Berkshire Hathaway offices (year range from press) | New Bedford, Massachusetts |
| 1971 | date not known | Berkshire Hathaway offices (year range from press) | New Bedford, Massachusetts |
| 1970 | date not known | Berkshire Hathaway offices (year range from press) | New Bedford, Massachusetts |
| 1969 | Tuesday, April 22, 1969 | Berkshire Hathaway offices | New Bedford, Massachusetts |
| 1968 | Tuesday, April 23, 1968 (announced) | Berkshire Hathaway offices (year range from press) | New Bedford, Massachusetts |
| 1967 | January 1967 | Berkshire Hathaway offices | New Bedford, Massachusetts |
| 1966 | date not known | Berkshire Hathaway offices (year range from press) | New Bedford, Massachusetts |
| 1965 | Tuesday, December 7, 1965 | Berkshire Hathaway offices | New Bedford, Massachusetts |
How many people attend the Berkshire Hathaway annual meeting?
TL;DR: Berkshire does not publish a count. Buffett named more than 40,000 for 2015. The arena seats about 18,000; the rest watch from overflow rooms. Millions more watch online.
Since 2009 the meeting has drawn about 30,000 to 40,000 people every year. The exceptions: 2020 and 2021 were online only, with no audience, and 2026, the first meeting with Greg Abel as CEO, drew about 12,000 to 16,000 by our estimate. Only 2015, 2017 and 2018 went a little over 40,000.
Attendance is an estimate. Berkshire does not publish an official count. The best numbers come from Buffett himself, in his letters. Rough estimates, from the press or our own, show in a lighter color. For 1980 and 1988 Buffett gave no number, so the light bars show the count of the Omaha World-Herald.
Show the number for every meeting (1980 to 2026)
| Year | People |
|---|---|
| 2026 | 12,000 to 16,000 (estimate) estimate by Good Investing |
| 2025 | about 40,000 Buffett at the meeting |
| 2024 | 30,000 to 40,000 (estimate) estimate by Good Investing |
| 2023 | 30,000 to 40,000 (estimate) estimate by Good Investing |
| 2022 | 30,000 to 40,000 (estimate) estimate by Good Investing |
| 2021 | online only |
| 2020 | online only |
| 2019 | about 40,000 Berkshire news release |
| 2018 | more than 40,000 press |
| 2017 | about 42,000 press |
| 2016 | about 37,000 Buffett letter |
| 2015 | more than 40,000 Buffett letter |
| 2014 | a record 39,000 Buffett letter |
| 2013 | about 35,000 press |
| 2012 | about 35,000 press |
| 2011 | about 40,000 press |
| 2010 | 30,000 to 40,000 (estimate) Good Investing estimate from press reports |
| 2009 | about 35,000 Buffett letter |
| 2008 | about 31,000 Buffett letter |
| 2007 | about 27,000 Buffett letter |
| 2006 | about 24,000 Buffett letter |
| 2005 | about 21,000 Buffett letter |
| 2004 | about 19,500 Buffett letter |
| 2003 | about 15,000 press |
| 2002 | 13,000 to 14,000 press |
| 2001 | more than 12,000 press |
| 2000 | about 13,000 press |
| 1999 | about 15,000 press |
| 1998 | more than 10,000 Buffett letter |
| 1997 | about 7,500 Buffett letter |
| 1996 | about 5,000 Buffett letter |
| 1995 | about 4,000 Buffett letter |
| 1994 | more than 2,750 Buffett letter |
| 1993 | a record 2,200 Buffett letter |
| 1992 | a record 1,700 Buffett letter |
| 1991 | a record 1,550 Buffett letter |
| 1990 | a record 1,300 Buffett letter |
| 1989 | about 1,000 Buffett letter |
| 1988 | about 580 Omaha World-Herald |
| 1987 | about 450 Buffett letter |
| 1986 | about 450 Buffett letter |
| 1985 | more than 250 Buffett letter |
| 1981 | about 12 Buffett letter |
| 1980 | about 30 Omaha World-Herald |
How many people request a credential?
Far more people ask for a credential, the free admission pass, than come to Omaha: in 2025 Berkshire got a record 138,000 requests by mail, and about 40,000 people came. Many ask only for the shareholder discounts, for instance Nebraskans who shop at Nebraska Furniture Mart. In 2026 more than 125,000 asked, but only about 12,000 to 16,000 came, by our estimate.
How do meeting credentials work?
One share is enough: a single Class B share qualifies. Shareholders order up to four credentials on the form that comes with the proxy materials. Anyone who did not order ahead can still get one at the meeting with proof of owning shares on the record date: a proxy card, a voting form from a bank or broker, or a broker’s statement, plus ID.
Credentials have always had a second market. In 2004 fans bid up to $117 on eBay for a ticket. Press reports say Buffett wanted to stop people reselling at a profit, so Berkshire put about 10,000 tickets on eBay itself for a few dollars each. Reports give $2.50 or $5, and the price may have changed over time. In 2019 Quartz still found spare passes online for about $5 to $25.
How many people own Berkshire?
Between one and two million people own Berkshire. About 40,000 come to Omaha. About 53 get to ask a question.
Berkshire has one meeting a year and a very large group of owners. Here is how that group gets smaller, from everyone who owns a share to the few people who stand at a microphone.
How likely is it to ask a question from the floor? About 1 in 2,000 today, based on the 1,743 questions in our transcripts.
Why does nobody know the exact number of owners?
Most people hold Berkshire through a broker. Their shares sit in the broker’s name, so Berkshire never sees them. That is why three honest numbers are so far apart.
Source: Berkshire 10-K for 2025, Item 5.
Source: our 2019 meeting transcript.
Source: our 2022 meeting transcript.
How did the meeting become a shopping weekend?
TL;DR: In 1997 Nebraska Furniture Mart sold $5.3 million in the meeting week. By 2017 it was $44.6 million. In the hall, See’s candy went from 747 pounds in 1995 to more than 18,000 in 2024.
Buffett made the meeting a weekend. Shareholders got employee discounts at Nebraska Furniture Mart and Borsheims, the hall next to the arena filled with Berkshire products, and from 2013 the Brooks 5K ran on Sunday. For years he reported the results in his letters, often down to the second.
Nebraska Furniture Mart sales in the meeting week
From $5.3 million in 1997 to $44.6 million in 2017, the last week total Buffett published. After that he only gave single days: on the Tuesday of the 2019 meeting week the store did $9.3 million.
Sources: Buffett’s letters to shareholders; 2019 from the meeting transcript. Years without a published figure are left out. 1998 is calculated from the 1999 letter. The discount period grew from five days to a full week over the years.
Pounds of See’s candy sold at the meeting
From 747 pounds in 1995 to more than 18,000 in 2024.
Sources: Buffett’s letters to shareholders; 2024 from Barron’s. Not fully comparable: the 1990s were one meeting day at Aksarben and the Civic, 2010 to 2014 a nine-hour Saturday, 2024 two shopping days.
| In the hall | 1995 | 1999 | 2014 | 2024 |
|---|---|---|---|---|
| See’s candy (pounds) | 747 | 3,059 | 13,440 | 18,000+ |
| Shoes and boots (pairs) | 759 | 1,928 Dexter | 1,385 Justin | – |
| Knives (sets) | 400 | 895 | – | – |
| Also sold | World Book for $17,500 | 3,446 pieces of apparel, 1,752 golf balls | 7,276 pairs of gloves, 10,000 bottles of Heinz ketchup | 22,000 Dilly bars |
Borsheims rarely gave a sales figure, but Buffett liked to count the speed of the tills:
Borsheims, 1995
13 seconds
One sales ticket every 13 seconds on Shareholders Day: 1,733 tickets in six hours.
Borsheims, 1998
11.5 seconds
2,501 tickets in eight hours on Sunday. Sales were double those of the year before.
The Bookworm, 2005
3,500
copies of Poor Charlie’s Almanack, one every 9 seconds.
NFM, best single days
$9.3 million
on the Tuesday of the 2019 meeting week. Saturday records: $6.1 million in 2004, $7.2 million in 2008, $8.2 million in 2013.
Brooks 5K, since 2013
2,796 finishers
in 2025, after 2,434 in 2024, 2,116 in 2023 and 1,230 in 2022. Before the pandemic: 2,660 in 2018 and 2,683 in 2019 (3,214 signed up). In 2026: 1,527. About 2,000 ran the first race in 2013 (WBUR). Counted from the official results.
Justin boots, 2014
1,385 pairs
in a nine-hour Saturday, a pair every 23 seconds.
What is the media history of the Berkshire meeting?
TL;DR: Nobody streamed the meeting until 2016. Yahoo Finance streamed it from 2016 to 2021. CNBC has since 2022. Journalists joined the Q&A in 2009, analysts in 2012.
From 1994 to 2015 Berkshire filmed the meeting, but only people in the hall could see it. Visitors and press were not allowed to record. Then the meeting got too big for the arena.
In his letter for 2015, Buffett wrote: “Charlie and I have finally decided to enter the 21st Century.” Two reasons: the arena was full with more than 40,000 people, and shareholders could check that he and Munger were still fit.
What changed, year by year?
All 28 changes, year by year
- 1990: The Omaha World-Herald reports that cameras and tape recorders are banned at the meeting. A public TV crew still films briefly.
- 1990: Borsheim’s, normally closed on Sundays, opens for shareholders on the Sunday of the meeting weekend. By 1996 it is called “Shareholder Sunday”. It ran until at least 2018.
- 1994: The first baseball game for the meeting weekend: the league schedules an Omaha Royals home game at Rosenblatt Stadium, and shareholders order tickets with the proxy. Buffett, who owned 25% of the Royals, throws the first pitch, as he had at a Royals game in 1993. The games ran until 2002.
- 1996: Gorat’s, Buffett’s favorite steakhouse, opens on the Sunday evening of the meeting weekend for shareholders. It did so until at least 2018.
- 1996 to 2024: The meeting opens with a Berkshire movie, made by CFO Marc Hamburg (shown since at least 1996). In 2025 there is no movie for the first time.
- 1997: Nebraska Furniture Mart starts “Berkshire Weekend” pricing: shareholders get the employee discount. Sales that week grow from $5.3 million in 1997 to $44.6 million in 2017.
- 1998: 46 media outlets came to the meeting, 13 of them from outside the US. It is the only media count in Buffett’s letters.
- 2004: Buffett said from the stage that no one may film the meeting. Anyone who does has to leave.
- 2004 to 2009: A reception for shareholders from outside the US and Canada, on Saturday after the meeting, where Buffett and Munger greet every guest. It grows from more than 400 guests in 2004 to about 800 in 2009. Buffett drops it in 2010, because signing one item per guest took him about 2½ hours.
- 2009: Three journalists join the Q&A: Carol Loomis (Fortune), Becky Quick (CNBC) and Andrew Ross Sorkin (The New York Times). They read questions that shareholders send in by email. In the hall, a drawing at 8:15 a.m. at each microphone now picks who asks. Until 2008, whoever got to one of the 12 microphones first could ask, so people rushed in when the doors opened at 7 a.m. Buffett made both changes to bring more questions about Berkshire and to stop the sprint (letter for 2008).
- 2012: Three analysts join them on stage. In 2013 one of the seats went to a short seller, Doug Kass. The analyst panel ran until 2019.
- 2012: After Berkshire buys the Omaha World-Herald, Buffett starts the Newspaper Tossing Challenge: throw a paper 35 feet onto the porch of a Clayton home. It ran until at least 2017.
- 2013: Fan channels on YouTube start to cut Buffett clips from interviews and old meetings into short videos. They make him easy to find in search.
- 2013: The first Berkshire 5K, a Sunday morning race from the arena, with a special Brooks running shoe. It ran until at least 2018.
- 2015: The exhibit hall opens on Friday afternoon too, so shareholders can shop before the meeting. It still did in 2025.
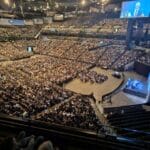
- 2015: More than 40,000 people fill the arena and its overflow rooms and spill into two halls of the Omaha Hilton next door. Airbnb collects extra rooms because hotels sell out. Buffett names the crowd as one reason for the first livestream in 2016.
- 2016: The first livestream, on Yahoo Finance, with a Mandarin translation.
- 2017: Partners in China stream the meeting too, and it comes out as an audio podcast for the first time.
- May 5, 2018: CNBC opens its Warren Buffett Archive: more than 120 hours of video, every meeting since 1994.
- 2018 to 2021: Fans upload the archive videos to YouTube. Meetings from the 1990s still get more than 100,000 views each.
- 2020 and 2021: Online meetings. In 2020 Buffett spoke in an empty arena in Omaha, and Becky Quick picked the questions from her home in New Jersey. In 2021 the meeting came from Los Angeles.
- 2020 to 2022: The pandemic moves more people to YouTube. Views of meeting videos jump: about 600,000 for the 2020 meeting, 1.4 million for 2021 and 5.8 million for 2022, mostly short clips.
- 2022: CNBC takes over, on TV and as a stream. Becky Quick reads email questions in turns with shareholders in the hall.
- 2023: CNBC puts the full meeting on its YouTube channel. The 2023 video has more than 333,000 views today.
- 2024: The first meeting without Charlie Munger opens with a film tribute to him. For the first time, viewers outside Omaha can watch a meeting film.
- 2025: Berkshire warns of AI-made fake videos of Buffett on YouTube. Buffett announces he will step down as CEO.
- 2025: A shorter meeting: without the movie, it starts a bit earlier, at 8 a.m., and ends at 1 p.m. After the break only Greg Abel sits next to Buffett.
- 2026: Greg Abel’s first meeting as CEO, the fifth year in a row on CNBC, in a new format: Abel opens with a business update, then answers questions in two blocks. The heads of BNSF (Katie Farmer) and NetJets (Adam Johnson) join him on stage, and Buffett, then chairman, speaks from the front row.
How does the world watch the meeting online?
TL;DR: Two eras that are hard to compare. Yahoo streamed from 2016 to 2021 and published live views, up to about 7 million in 2017. CNBC streams since 2022 and publishes none. Meeting videos on YouTube passed 23 million views.
For about 50 years, you had to be in the room to hear Warren Buffett answer questions. Berkshire filmed its own meetings from 1994 on, but visitors could not record, and Buffett said no to a webcast as late as 2009. That changed in 2016. In his letter for 2015, Buffett wrote that he and Charlie Munger had “finally decided to enter the 21st Century.” He gave two reasons. The arena was full, and shareholders should be able to check that the two men were still sharp. Buffett was 85 then, Munger 92.
The Yahoo years, 2016 to 2021
Yahoo Finance streamed the first meeting on April 30, 2016, with a live Mandarin translation. Buffett reported 1.1 million unique visits in real time and 11.5 million replays. Yahoo counted 1.8 million live views, and about 500,000 people watched from China in the middle of the night. One year later, live views on Yahoo rose 72% to about 3.1 million. Partners in China added another 3.9 million live views. Replays reached 17.1 million.
In 2020 the meeting went online. Buffett and Greg Abel spoke in an empty arena, and Yahoo was the only place to watch the full stream. Yahoo reported 2.5 million live streams and an average watch time of 19 minutes. Buffett called it a “record-sized international audience.” In 2021, Yahoo also streamed the meeting on TikTok for the first time. Yahoo published no audience numbers for 2019 or 2021.
Show every published audience number with its source
| Meeting | Published audience | Source |
|---|---|---|
| 2016 | 1.8 million live views on Yahoo, 1.1 million unique live visits and 11.5 million replays. About 500,000 people watched from China. | Berkshire letter for 2016, Fierce Video, Talking Biz News |
| 2017 | 1.43 million unique viewers and 3.1 million live views on Yahoo, plus 3.9 million live views through partners in China; 17.1 million replays | Berkshire letter for 2017, Yahoo Finance |
| 2018 | “35 million people”, a Yahoo claim with no method given, likely with clips and social media. Not comparable with the live views. | MediaPost, Omaha World-Herald (June 10, 2019) |
| 2019 | No number published | None found |
| 2020 | 2.5 million live streams on Yahoo, 19 minutes watched on average. Buffett: a “record-sized international audience”. | Deadline (April 2021), Berkshire letter for 2020 |
| 2021 to 2026 | No numbers published by Yahoo or CNBC | None found |
The CNBC years, since 2022
Since 2022, CNBC has been the exclusive home of the meeting, on TV and on CNBC.com, with a Mandarin stream on CNBC.com in 2024. CNBC publishes no audience numbers, so these years cannot be compared with Yahoo’s live views. What we can count: CNBC puts the full meeting on its YouTube channel.
Views of CNBC’s full meeting video on YouTube, 2023 to 2026
2023 was Charlie Munger’s last meeting. In 2025 Buffett said he would step down as CEO. Older videos have had more time to collect views.
Show the numbers
The YouTube archive and the online wave
The archive gives the meeting a second life. In May 2018, CNBC opened the Warren Buffett Archive with every meeting since 1994. Fans uploaded the old meetings to YouTube. By February 2026, videos of the meetings from 1994 to 2025 had at least 23 million views by our count. The newest meetings draw the most: 2020 to 2025 make up 83% of those views. Still, a single upload of the 1994 meeting has passed 350,000 views, more than 30 years later.
YouTube views of the meetings from before the archive, 1994 to 2017
These meetings were only online once CNBC opened its archive in 2018. Together they have 3.6 million views, 15% of all. 19 of the 24 have 100,000 to 210,000. The 1990s draw twice as much as the 2000s: about 224,000 views per meeting against 108,000.
YouTube views of the meetings since 2018
In 2018 and 2019 a new meeting drew about 200,000 views, no more than the old ones. Since 2020 every meeting has had at least 600,000. 2022 and 2023 have about 5.7 million each, most of it from clips. 2020 to 2025 make up 83% of all views.
Views counted in February 2026.
Show YouTube views for every meeting (1994 to 2025)
| Meeting | Long videos | Clips | Total |
|---|---|---|---|
| 2025 | 1,595,000 | 2,018,000 | 3,613,000 |
| 2024 | 1,182,000 | 1,107,000 | 2,289,000 |
| 2023 | 2,560,000 | 3,185,000 | 5,745,000 |
| 2022 | 363,700 | 5,391,000 | 5,754,700 |
| 2021 | 144,400 | 1,289,300 | 1,433,700 |
| 2020 | 483,500 | 117,000 | 600,500 |
| 2019 | 135,000 | 65,000 | 200,000 |
| 2018 | 115,000 | 85,000 | 200,000 |
| 2017 | 92,000 | 78,000 | 170,000 |
| 2016 | 75,000 | 60,000 | 135,000 |
| 2015 | 98,000 | 62,000 | 160,000 |
| 2014 | 94,200 | 48,000 | 142,200 |
| 2013 | 104,200 | 65,700 | 169,900 |
| 2012 | 101,700 | 39,600 | 141,300 |
| 2011 | 44,400 | 71,100 | 115,500 |
| 2010 | 59,100 | 67,700 | 126,800 |
| 2009 | 58,100 | 22,000 | 80,100 |
| 2008 | 93,300 | 45,000 | 138,300 |
| 2007 | 83,100 | 49,500 | 132,600 |
| 2006 | 71,000 | 46,100 | 117,100 |
| 2005 | 46,800 | 38,200 | 85,000 |
| 2004 | 91,500 | 50,500 | 142,000 |
| 2003 | 78,000 | 32,000 | 110,000 |
| 2002 | 44,000 | 46,000 | 90,000 |
| 2001 | 91,700 | 23,300 | 115,000 |
| 2000 | 49,200 | 24,400 | 73,600 |
| 1999 | 109,000 | 101,000 | 210,000 |
| 1998 | 82,000 | 98,000 | 180,000 |
| 1997 | 115,000 | 95,000 | 210,000 |
| 1996 | 85,000 | 95,000 | 180,000 |
| 1995 | 50,500 | 310,000 | 360,500 |
| 1994 | 145,000 | 60,500 | 205,500 |
| All | 8,540,400 | 14,885,900 | 23,426,300 |
Where do the readers of our guides come from?
Mostly from the same places as the askers at the meeting (chapter 07). Two independent sources point to the same cities: the home towns people name at the microphone (1994 to 2025) and the locations of 159,531 visits to our AGM guides (June 2022 to October 2026, 62% of them from the US). In the US, New York, Chicago and Omaha lead both lists. Outside the US, Canada and Germany lead both.
Show the numbers for the US
The same cities at the microphone and in our readership
Share of each US metro area. New York, Chicago and Omaha are in the top three of both lists (dark green).
At the microphone
620 questions with a US home town, 1994 to 2025
Readers of our AGM guides
57,598 US visits with a known city, June 2022 to October 2026
Sources: Good Investing transcripts (home towns named by askers, matched automatically to metro areas within 45 km, so the figures are indicative) and Good Investing website analytics (Matomo; known data center locations removed). In the readership list, Omaha includes readers who look up the guide during the meeting week.
| Outside the US | Share of questions | Share of visits |
|---|---|---|
| Canada | 19% | 18% |
| Germany | 19% | 9% |
| United Kingdom | 9% | 8% |
| China | 10% | 3% |
| Australia | 8% | 5% |
| Brazil | 1% | 5% |
Europe looks different from the US. At the microphone, London leads with 11 questions, followed by Bonn with 7 and Munich with 5. Among our readers, London is the one large hub with 2,034 visits. German readers spread across Hesse, Bavaria and North Rhine-Westphalia, with no single center. Frankfurt shows 2,177 visits, but that number is likely too high: German visits without an exact location are often placed there.
Buffett fans per million people: which countries stand out?
Large countries send many readers simply because they are large. To compare them fairly, we divided the visits to our AGM guides by each country’s population. Singapore comes first with 388 visits per million people, ahead of the US (289), Canada (265) and Hong Kong (249). Switzerland (124) follows, then Australia (100). In Europe, Ireland, Finland, Sweden, Belgium, Denmark, Norway, the UK and Germany sit close together at 64 to 86. France (9) and Italy (12) are far behind. By continent, North America has 185 visits per million people, Oceania 69 and Europe 29. Asia’s average of 3 hides Singapore and Hong Kong near the top of the country list.
Language explains part of the gap: our guides exist in English and German only. Belgium shows it within one country. Dutch-speaking Flanders has 67 visits per million people, French-speaking Wallonia 8.
The askers at the meeting point the same way. Switch the map to “Askers at the meeting”: the US leads with 3.2 questions per million people since 1994, followed by Canada (1.3), Hong Kong (1.2), Singapore (1.0) and Australia (0.8). Two independent measures, decades apart, put the same group of countries at the top.
How we counted, and what the numbers cannot show
- Readers: about 159,500 visits to our AGM guides in 184 countries and territories, 01/06/2022 to 31/10/2026. A visit is not a person: one reader can come back many times.
- The country comes from the IP address. VPNs and company networks can place a reader in the wrong country.
- Ranked are countries with at least 1 million people and at least 100 visits (for questions: at least 5). Below that, a few visits move the rate a lot. Estonia, for example, reaches 102 per million with 140 visits.
- Small states and territories are listed separately. Bermuda has 699 visits for about 65,000 people.
- Askers: questions from the floor and by email whose asker named a country, 1994 to 2026, divided by today’s population.
- Continents: visits divided by the population of all countries on the continent (World Bank 2025), including countries without visits.
- Belgian regions: 457 visits from Flanders and 28 from Wallonia (Matomo; 296 Belgian visits have no region), population from Statbel on 01/01/2025.
Who asks the questions, and where are they from?
TL;DR: About 10% of the questions came from outside the US in the 1990s and 37% since 2020. The askers came from 39 countries. Canada and Germany lead.
We looked up where each person at the microphone or in the email questions said they live. We could place 1,332 of the questions from 1994 to 2025. Analysts and journalists on the panels are not counted, and neither are speeches on shareholder proposals. 2026 is left out because our transcript of it is shorter.
How many questions come from outside the US?
In the 1990s about one question in ten came from outside the US. Since 2020 it is more than one in three. In 2019 it passed half for the first time: 52%.
Share of questions from outside the US
The share has gone up in every decade, from 10% in 1994 to 1999 to 37% in 2020 to 2025. The dashed line is the average over all years: 20%.
Show the numbers
| Meetings | Questions with a known country | From outside the US | Share |
|---|---|---|---|
| 1994 to 1999 | 385 | 37 | 10% |
| 2000 to 2009 | 472 | 91 | 19% |
| 2010 to 2019 | 336 | 85 | 25% |
| 2020 to 2025 | 139 | 51 | 37% |
| All | 1,332 | 264 | 20% |
Which countries ask the most questions?
After the US with 1,068 questions, Canada and Germany asked the most. Germany, Austria and Switzerland together asked 62 questions. The first question from Germany came in 2000.
Where do the askers live?
The askers came from 39 countries. Four in five questions came from the US. Outside the US, Canada and Germany lead with about 50 questions each.
Where the askers live: 1,332 questions, 1994 to 2025
Outside the US: 264 questions from 38 countries
27 more countries asked one to four questions:
Year by year: each dot below is one question whose asker named a home town. Press Play or drag the slider to see how the map filled up from 1994 to 2026. The list on the right counts the questions of the selected year by city, state or US region (on the world map: by country or region). Switch to the five-year phase for larger groups.
The people who read about the meeting live in the same places: New York, Chicago and Omaha lead both lists in the US, Canada and Germany outside it. See where the readers of our guides come from and Buffett fans per million people in chapter 06.
When did each country ask its first question?
Three countries asked questions in 1994: the US, Canada and Sweden. By 2025 it was 39.
| Meeting | First question from | Total |
|---|---|---|
| 1994 | United States, Canada, Sweden | 3 |
| 1995 | Singapore, Saudi Arabia | 5 |
| 1996 | United Kingdom, Switzerland, Portugal, US Virgin Islands | 9 |
| 1997 | Australia | 10 |
| 1999 | Ireland | 11 |
| 2000 | Germany, Hong Kong | 13 |
| 2001 | China, Japan, Belarus | 16 |
| 2002 | South Africa | 17 |
| 2003 | India, Austria | 19 |
| 2004 | Mexico, Greece, Trinidad and Tobago | 22 |
| 2006 | Brazil, Norway | 24 |
| 2007 | Kuwait | 25 |
| 2009 | Philippines | 26 |
| 2010 | Israel, New Zealand | 28 |
| 2013 | Macau | 29 |
| 2014 | Taiwan, Italy | 31 |
| 2015 | Venezuela | 32 |
| 2018 | Ukraine | 33 |
| 2019 | Panama, Belgium | 35 |
| 2023 | Malaysia | 36 |
| 2024 | Spain | 37 |
| 2025 | Guatemala, Mongolia | 39 |
Who gets to ask a question?
1,743 questions at 33 meetings, from the floor, by email and from analysts on stage. Our full analysis has its own article.
From 1994 to 2025 shareholders asked 1,743 questions: 1,220 from the floor, 372 by email through journalists, 144 from analysts on stage and 7 from the journalists themselves. Since 2009 a drawing at each microphone decides who asks.
1 in 2,000
Chance to ask from the floor at a typical meeting today. In 1994 it was 1 in 43.
10%
Questions asked by women, steady for 30 years. At the microphones the share has gone up since about 2014.
2% to 11%
Share of questions about who follows Buffett, from the 1990s to the 2020s.
0 of 225
Questions since 2020 on how to value a business. In the 1990s it was about 1 in 20.
Did the answers get longer?
Yes. We timed every question in our transcripts from 1994 to 2025. From 1994 to 1998 a question and its answer usually took three to four minutes. Since 2023 it takes six to eight. That is the main reason why only 32 to 48 questions fit into a meeting today, against 54 to 92 in the 1990s.
Questions per hour of Q and A, 1994 to 2025
From 1994 to 1998 Buffett and Munger answered about 16 questions an hour. Since 2023 it is 8 to 10. The answers got longer, so fewer questions fit in.
Words per question and answer
A question and its answer took about 600 words from 1994 to 1998 and about 950 since 2023. 2022 is an outlier with only 23 questions.
Source: Good Investing transcripts, 1994 to 2025. Time runs from the first to the last question, so it includes short breaks but not the last answer. 2020 and 2021 were online meetings. In 2022 our transcript counts only 23 questions, and several answers ran past 2,500 words.
What was the Berkshire share price at each meeting?
TL;DR: One BRK.A share cost $15,450 at the 1994 meeting and $710,300 at the 2026 meeting. In 12 of 33 years the S&P 500 did better in the 12 months before the meeting.
The chart shows BRK.A and the S&P 500 at each meeting, both set to 100 at the 1994 meeting.
Show the price and market backdrop for every meeting
| Year | BRK.A | Market backdrop |
|---|---|---|
| 2026 | $710,300 | Buffett hands over |
| 2025 | $809,350 | Tariff shock |
| 2024 | $603,000 | AI rally, high rates |
| 2023 | $491,840 | Bank failures |
| 2022 | $484,340 | Inflation, Ukraine war |
| 2021 | $412,500 | Stimulus, meme stocks |
| 2020 | $273,975 | COVID crash |
| 2019 | $327,766 | Trade war |
| 2018 | $292,600 | Corporate tax cut |
| 2017 | $250,000 | Brexit, Trump election |
| 2016 | $219,000 | First hike since 2006 |
| 2015 | $215,800 | Oil price crash |
| 2014 | $192,255 | Bull market |
| 2013 | $162,904 | QE3, fiscal cliff |
| 2012 | $121,950 | Euro crisis, US downgrade |
| 2011 | $124,750 | QE2, Japan quake |
| 2010 | $115,325 | Slow recovery |
| 2009 | $92,005 | Financial crisis |
| 2008 | $133,600 | Bear Stearns rescue |
| 2007 | $109,250 | Housing peak |
| 2006 | $88,710 | Hurricane Katrina |
| 2005 | $84,350 | Fed hikes, insurance probes |
| 2004 | $93,390 | Recovery, 1% rates |
| 2003 | $70,400 | Bear market, Iraq war |
| 2002 | $74,300 | 9/11 and Enron |
| 2001 | $67,005 | Dot-com bust |
| 2000 | $59,300 | Dot-com peak |
| 1999 | $75,600 | LTCM, internet boom |
| 1998 | $69,100 | Asian crisis |
| 1997 | $39,000 | Irrational exuberance |
| 1996 | $33,800 | Fed cuts, GEICO deal |
| 1995 | $22,200 | Rate shock, peso crisis |
| 1994 | $15,450 | Fed starts hiking |
Did Berkshire beat the S&P 500 before each meeting?
Mostly yes. We compared the BRK.A price with the S&P 500 over the 12 months before each meeting. Berkshire did better in 21 of 33 years. The S&P 500 did better in 12: 1997, 1999, 2000, 2005, 2006, 2010, 2011, 2012, 2017, 2020, 2024 and 2026.
The best year was 1998: Berkshire rose +82.4%, the S&P 500 +37.9%. The worst was 2026, the first meeting with Greg Abel as CEO: Berkshire fell 12.2% while the S&P 500 rose 27.1%.
Show Berkshire and the S&P 500 before every meeting
| Meeting | BRK.A | S&P 500 | Difference (points) |
|---|---|---|---|
| 2026 | -12.2% | +27.1% | -39.4 |
| 2025 | +34.2% | +10.9% | +23.3 |
| 2024 | +22.6% | +24.0% | -1.4 |
| 2023 | +1.5% | +0.1% | +1.4 |
| 2022 | +17.4% | -1.2% | +18.6 |
| 2021 | +50.6% | +47.7% | +2.9 |
| 2020 | -16.4% | -3.9% | -12.5 |
| 2019 | +12.0% | +10.6% | +1.4 |
| 2018 | +17.0% | +11.0% | +6.0 |
| 2017 | +14.2% | +16.2% | -2.0 |
| 2016 | +1.5% | -2.0% | +3.5 |
| 2015 | +12.2% | +12.1% | +0.2 |
| 2014 | +18.0% | +16.5% | +1.5 |
| 2013 | +33.6% | +17.9% | +15.7 |
| 2012 | -2.2% | +0.4% | -2.6 |
| 2011 | +8.2% | +14.9% | -6.7 |
| 2010 | +25.3% | +35.2% | -9.9 |
| 2009 | -31.1% | -37.9% | +6.8 |
| 2008 | +22.3% | -6.1% | +28.4 |
| 2007 | +23.2% | +13.6% | +9.6 |
| 2006 | +5.2% | +14.6% | -9.4 |
| 2005 | -9.7% | +4.5% | -14.2 |
| 2004 | +32.7% | +19.1% | +13.6 |
| 2003 | -5.2% | -13.4% | +8.1 |
| 2002 | +10.9% | -14.3% | +25.2 |
| 2001 | +13.0% | -13.7% | +26.7 |
| 2000 | -22.4% | +8.8% | -31.2 |
| 1999 | +10.2% | +19.1% | -8.9 |
| 1998 | +82.4% | +37.9% | +44.5 |
| 1997 | +13.3% | +26.7% | -13.4 |
| 1996 | +55.3% | +24.7% | +30.7 |
| 1995 | +39.8% | +15.0% | +24.8 |
| 1994 | +23.1% | +2.4% | +20.7 |
How much did Berkshire gain since 1994?
Closing prices before the meetings.
Price index, no dividends.
Dividends matter for this comparison. Berkshire’s own table counts them for the S&P 500, by calendar year. From the start of 1994 to the end of 2025, the Berkshire share price rose 4,519%, or 12.7% a year. The S&P 500 with dividends rose 2,583%, or 10.8% a year. By calendar year, Berkshire did better in 20 of these 32 years. The S&P 500 was ahead in the rest, including 1999, 2019 and 2025.
Show Berkshire and the S&P 500 with dividends for every year (1965 to 2025)
| Year | Berkshire share price | S&P 500 with dividends | Difference (points) |
|---|---|---|---|
| 2025 | +10.9% | +17.9% | -7.0 |
| 2024 | +25.5% | +25.0% | +0.5 |
| 2023 | +15.8% | +26.3% | -10.5 |
| 2022 | +4.0% | -18.1% | +22.1 |
| 2021 | +29.6% | +28.7% | +0.9 |
| 2020 | +2.4% | +18.4% | -16.0 |
| 2019 | +11.0% | +31.5% | -20.5 |
| 2018 | +2.8% | -4.4% | +7.2 |
| 2017 | +21.9% | +21.8% | +0.1 |
| 2016 | +23.4% | +12.0% | +11.4 |
| 2015 | -12.5% | +1.4% | -13.9 |
| 2014 | +27.0% | +13.7% | +13.3 |
| 2013 | +32.7% | +32.4% | +0.3 |
| 2012 | +16.8% | +16.0% | +0.8 |
| 2011 | -4.7% | +2.1% | -6.8 |
| 2010 | +21.4% | +15.1% | +6.3 |
| 2009 | +2.7% | +26.5% | -23.8 |
| 2008 | -31.8% | -37.0% | +5.2 |
| 2007 | +28.7% | +5.5% | +23.2 |
| 2006 | +24.1% | +15.8% | +8.3 |
| 2005 | +0.8% | +4.9% | -4.1 |
| 2004 | +4.3% | +10.9% | -6.6 |
| 2003 | +15.8% | +28.7% | -12.9 |
| 2002 | -3.8% | -22.1% | +18.3 |
| 2001 | +6.5% | -11.9% | +18.4 |
| 2000 | +26.6% | -9.1% | +35.7 |
| 1999 | -19.9% | +21.0% | -40.9 |
| 1998 | +52.2% | +28.6% | +23.6 |
| 1997 | +34.9% | +33.4% | +1.5 |
| 1996 | +6.2% | +23.0% | -16.8 |
| 1995 | +57.4% | +37.6% | +19.8 |
| 1994 | +25.0% | +1.3% | +23.7 |
| 1993 | +38.9% | +10.1% | +28.8 |
| 1992 | +29.8% | +7.6% | +22.2 |
| 1991 | +35.6% | +30.5% | +5.1 |
| 1990 | -23.1% | -3.1% | -20.0 |
| 1989 | +84.6% | +31.7% | +52.9 |
| 1988 | +59.3% | +16.6% | +42.7 |
| 1987 | +4.6% | +5.1% | -0.5 |
| 1986 | +14.2% | +18.6% | -4.4 |
| 1985 | +93.7% | +31.6% | +62.1 |
| 1984 | -2.7% | +6.1% | -8.8 |
| 1983 | +69.0% | +22.4% | +46.6 |
| 1982 | +38.4% | +21.4% | +17.0 |
| 1981 | +31.8% | -5.0% | +36.8 |
| 1980 | +32.8% | +32.3% | +0.5 |
| 1979 | +102.5% | +18.2% | +84.3 |
| 1978 | +14.5% | +6.4% | +8.1 |
| 1977 | +46.8% | -7.4% | +54.2 |
| 1976 | +129.3% | +23.6% | +105.7 |
| 1975 | +2.5% | +37.2% | -34.7 |
| 1974 | -48.7% | -26.4% | -22.3 |
| 1973 | -2.5% | -14.8% | +12.3 |
| 1972 | +8.1% | +18.9% | -10.8 |
| 1971 | +80.5% | +14.6% | +65.9 |
| 1970 | -4.6% | +3.9% | -8.5 |
| 1969 | +19.4% | -8.4% | +27.8 |
| 1968 | +77.8% | +11.0% | +66.8 |
| 1967 | +13.3% | +30.9% | -17.6 |
| 1966 | -3.4% | -11.7% | +8.3 |
| 1965 | +49.5% | +10.0% | +39.5 |
Which books sell at the Berkshire meeting?
TL;DR: Poor Charlie’s Almanack was on sale at 10 of the meetings we have lists for. No other book comes close.
At every meeting, The Bookworm, an Omaha bookstore, runs the bookstore in the exhibition hall. Berkshire approves the titles; in 2026 Warren Buffett and Greg Abel signed off on the list. We found full lists for 2016, 2019 and 2026 and single titles for 12 more years. In 2024 and 2025 the store sold only one book each: Poor Charlie’s Almanack and Berkshire’s 60th anniversary book.
| # | Book | Author | Meetings |
|---|---|---|---|
| 1 | Poor Charlie’s Almanack | Charlie Munger | 10 |
| 2 | Berkshire Hathaway Letters to Shareholders | Max Olson, ed. | 5 |
| 3 | The Essays of Warren Buffett | Lawrence Cunningham | 4 |
| 3 | Seeking Wisdom | Peter Bevelin | 4 |
| 3 | Forty Chances | Howard G. Buffett | 4 |
| 6 | The Oracle and Omaha | Steve Jordon | 3 |
| 6 | The Intelligent Investor | Benjamin Graham | 3 |
| 6 | Tap Dancing to Work | Carol Loomis | 3 |
| 6 | The Outsiders | William Thorndike | 3 |
| 6 | Where Are the Customers’ Yachts? | Fred Schwed | 3 |
| 6 | Life Is What You Make It | Peter Buffett | 3 |
Outside Omaha, the Buffett book market is huge. 428 titles in 14 library catalogs carry his name, against 57 for George Soros, the next investor. After we take out junk, summaries and duplicates, 196 different books remain. Read our analysis of the Warren Buffett book market and our list of the best Berkshire books.
Discover the Berkshire Hathaway Annual Meeting
AGM research by an “Omaha nerd”, condensed. Become an AGM pro and save time, money, and effort.
Guide
AGM 2027
Everything you need to know about the second Annual Meeting under Greg Abel’s lead.
Get ready for 2027


Get the free Good Investing newsletter, including our Berkshire meeting updates for 2027: dates, tickets and travel tips.


Notes and sources
TL;DR: How we counted and where the numbers come from, for every chart and table on this page. Each chart links to its note.
1. Key numbers (back to the numbers)
Source: Guinness World Records, “Largest AGM attendance” (about 42,000 in Omaha on May 6, 2017, an estimate). Meetings and questions: our transcripts, 1994 to 2026. Countries: our transcripts, 1994 to 2025. People in Omaha: Buffett’s letters, press and our estimate. Credential requests: CNBC. Live views: Berkshire letter for 2017, Yahoo. YouTube views: our count, February 2026. Venues: our venue table.
2. Venue map (back to the chart)
Note: Numbers follow the timeline above; 9 and 11 are the same arena. In 1999 the Holiday Convention Centre (6) was a second site next to Aksarben. Markers placed by street address. New Bedford (1) and Los Angeles (10) are not on the map.
Source: our venue table; map: Google Maps. Data as of October 2026.
3. Venue table (back to the chart)
Source: Why it moved: Buffett’s letters (1985, 1989, 1994, 1996, 1997, 1999, 2003, 2020), the Omaha World-Herald (May 1, 1990, April 26, 1994, August 25 and 26, 1999, and May 2, 2015) and the Lincoln Journal Star (August 31, 2003). 2021: Buffett’s opening words in our transcript; the office tower from Yahoo Finance (May 1, 2021); Berkshire’s 2021 proxy statement names no building. “Likely” means no source names the reason.
4. Baseball game 1994 (back to the chart)
Source: Omaha World-Herald, April 25 and 26, 1989, and April 26, 1994; Buffett’s letter for 1993 for the first game at meeting time.
5. Meeting dates table (back to the chart)
Source: 1994 to 2026 from the proxy statements Berkshire filed with the SEC. 1985 to 1993 dates and the Orpheum and Witherspoon Hall from Buffett’s letters. Venues before 1990 from the Omaha World-Herald (Steve Jordon, May 2, 2015), which gives year ranges. Dates for 1965 to 1969, the address and the first meeting under Buffett from The Standard-Times of New Bedford (December 5 and 7, 1965, January 24 and November 14, 1967, April 23, 1969); 1968 is the date announced in November 1967. Dates for 1966 and 1970 to 1984 are not known to us. People 1980 to 1994 and the 1994 overflow room from the Omaha World-Herald (May 22, 1985, May 21, 1986, May 24, 1988, April 25, 1989, May 1, 1990 and April 26, 1994). Our earlier source list said Joslyn from 1984; the World-Herald says 1986. Buffett’s letter for 1989 confirms Witherspoon Hall at Joslyn for the 1989 meeting.
6. Attendance chart and table (back to the chart)
Source: People: Buffett’s own numbers from his letters or the meeting where they exist, otherwise named press reports. Berkshire does not publish an official count. The year opens our transcript. People 2023, 2024 and 2026: estimate by Good Investing, who was there. 2025: Buffett at the meeting. Exhibition and sales numbers: Buffett at the opening of the 2025 meeting. Tickets, eBay and visitor origin: our records article and our 2026 attendance analysis.
7. Credentials chart (back to the chart)
Note: A credential is the free admission pass, up to four per shareholder; it also unlocks the shareholder discounts. Sources count requested, mailed or issued credentials. Light green: derived or less certain (1996, 2005, 2008, 2023). Left out: 2004 (conflicting reports), 2007 and 2010 to 2022 (no totals published; 2020 and 2021 online only). People: the numbers from the chart above; grey = estimate or weaker source.
Source: Omaha World-Herald (1997 to 2009), Buffett’s letters for 1998 and 2000 and his remarks at the 1996 meeting, CNBC (2024 to 2026). Data as of October 2026.
8. Show-up rate chart (back to the chart)
Note: Show-up rate = people at the meeting divided by credentials requested, mailed or issued, the two numbers in the chart above. It is a rough ratio: one shareholder can ask for up to four credentials, and most crowd counts are estimates. Light green: at least one of the two numbers is derived, an estimate or from a weaker source. 1996: the credential number itself is derived from Buffett’s 62%. Ranges use our crowd estimate (30,000 to 40,000; 2026: 12,000 to 16,000) or a press range (2002: 13,000 to 14,000). 2024 and 2026 are upper limits, because more than 127,000 and more than 125,000 asked; 1998 and 2001 are lower limits (more than 10,000 and more than 12,000 people). No rate for 2004, 2007 and 2010 to 2022. Diamonds: rates stated at the time by Buffett on stage (1996: 62%), his assistant Debbie Bosanek (2003: about 40%) and Berkshire spokeswoman Carrie Kizer (2009: a little more than 35%).
Source: our calculation from the chart above; stated rates: our 1996 transcript, Omaha World-Herald (May 3, 2003, and April 24, 2009). Data as of October 2026.
9. What changed chart (back to the chart)
Note: One marker for each point in the list below the chart. A dashed end means our sources stop mentioning it then, so it may have run longer. Grouping by type is ours.
Source: the sources named in the list below (Buffett’s letters, the Omaha World-Herald, Berkshire and CNBC, YouTube data, our transcripts). Data as of October 2026. Sources for the meeting weekend: Buffett’s letters for 1988, 1989, 1993, 1995, 1996, 2001, 2002, 2003, 2009, 2011, 2012, 2014, 2015, 2016, 2017 and 2024 (the letter for a year announces the next meeting); for 2026 2026 transcript. “Until at least” means our letters stop mentioning it then; details moved to an appendix after 2017.
Source: the Omaha World-Herald (May 1, 1990) for the camera ban, Berkshire shareholder letters (1998, 2015, 2016, 2017), our meeting transcripts 2004 to 2025, CNBC on the Buffett Archive, CNBC on the 2026 stream, Talking Biz News (2017) for the podcast and the Berkshire visitor guide 2024. Viewer numbers as published.
10. Livestream chart (back to the chart)
Note: Live views count streams, not people. Years without a bar: no number published. CNBC, the host since 2022, publishes no live numbers. Yahoo’s totals with clips and social media (35 million in 2018, 28.4 million in 2020) are not comparable and left out.
Source: Berkshire letters for 2016 and 2017; Yahoo Finance via Fierce Video (2016), Talking Biz News (2017) and Deadline (2020). Data as of October 2026.
11. YouTube views chart (back to the chart)
Note: Views by meeting year on all channels, rounded. Full meetings run over one hour, clips under one hour. A lower bound: one upload of the 1994 meeting alone had about 355,000 views in October 2026.
Source: Good Investing count of YouTube data, February 15, 2026. Data as of February 2026.
12. YouTube tables (back to the chart)
Source: CNBC videos: views on CNBC Television’s YouTube channel on October 20, 2026. The 2026 video is the newest, so it had the least time. All meetings: our own count from YouTube data on February 15, 2026, rounded. Long videos run over one hour, clips under one hour. Copies on other channels are included, so the numbers are estimates.
13. Questions from outside the US chart (back to the chart)
Note: Each column is one meeting, split by the region of the askers from outside the US. 2020 and 2021 were online only. 2026 left out (5 questions).
Source: Good Investing analysis of 1,332 questions with a known country in our transcripts. Data as of October 2026.
14. Owner cards (back to the chart)
Source: 17,450 record holders: Berkshire 10-K for 2025, Item 5. 1 to 2 million: Buffett at the 2019 meeting. 3.5 million Broadridge accounts: Buffett at the 2022 meeting. Attendance: chapter 03; Berkshire publishes no official count. Questions: our own count, 1,743 questions over 33 meetings, without speeches on shareholder proposals.
15. Share price chart and table (back to the chart)
Source: Chart: BRK.A and the S&P 500 (price index, without dividends) at the close on the last trading day before each meeting, both set to 100 at the 1994 meeting (Yahoo Finance daily closes). Table: BRK.A at the close on the meeting day, or for Saturday meetings the close on the Friday before. Market backdrop: the market news in the months before the meeting.
16. Berkshire vs. S&P 500 chart and table (back to the chart)
Note: Price change from the last trading day before the previous meeting to the last trading day before this meeting (Yahoo Finance daily closes; 1994 from StatMuse). The S&P 500 here is the price index without dividends. Berkshire pays no dividend.
17. Calendar-year table (back to the chart)
Source: Berkshire’s letter for 2025, table “Berkshire’s Performance vs. the S&P 500”: yearly change in the per-share market value of Berkshire and in the S&P 500 with dividends included. Gains for 1994 to 2025 are our own math from that table. Past results say nothing about the future.
